| MEP | MNP | |||
| EU | own country |
EU | own country |
|
| % | % | % | % | |
| very satisfied | 5 | 14 | 3 | 15 |
| fairly satisfied | 46 | 58 | 47 | 65 |
| not very satisfied | 37 | 22 | 40 | 17 |
| not at all satisfied | 13 | 7 | 10 | 3 |
| N = 100 % | 310 | 1392 | ||
| Groups/Regressions | R2 | x (Load) | x (Scope) |
| Mean all | 0.62 | 0.19 | 0.62 |
| Mean MEPs | 0.63 | 0.20 | 0.66 |
| Mean MNPs | 0.60 | 0.18 | 0.57 |
| Cross-country regression | 0.34*** | 0.19** | 0.62*** |
Aggregate regression of mean competence score for 17 policy areas for 15 groups of country MEPs and 11 groups of MNPs (n=17 for each regression); cross country regression n = 442.
* sign. at .05; ** sign. at .01; *** sign at .001.
| Corporatism Score | Union Density 1970-1990 | Legal Regulation of Union Systems | |
| (Correlation with Overall Competence Score) | |||
| All | -0.43 (n = 18) |
-0.57** (n = 26) |
-0.46* (n = 24) |
| MEP | -0.35 (n = 11) |
-0.64** (n = 14) |
-0.46 (n = 14) |
| MNP only | -0.72 (n = 7) |
-0.43 (n = 11) |
-0.48 (n = 10) |
* sign. at .05.; ** sign. at .01.
Independent variables are intervall scales.
| R2 | Beta (Union Density) |
Beta (Legal Regul.) |
||
| Regression 1 for: | Non-Social Policy Issues | 0.17*** | -0.40*** | -0.01 |
| Regression 2 for: | Social Policy and Equality Issues | 0.25*** | -0.25** | -0.30** |
Aggregate regression across policy fields and countries.
Number of cases: non-social policy issues 288; social policy and equality issues (social policy, health, unemployment, taxation, and education) 120.
| Model 1 beta |
Model 2 beta |
Model3 beta |
Model 4 beta |
Model 5 beta |
|
| Problem Load | 0.13*** | 0.14** | 0.14*** | 0.14*** | 0.14*** |
| Problem Scope | 0.53*** | 0.51*** | 0.51*** | 0.52*** | 0.52*** |
| Foreign Trade Dependency | 0.32*** | 0.29*** | |||
| Union Density | -0.19*** | -0.25*** | |||
| Legal Regulation of Union Systems | -0.17*** | -0.08*** | |||
| Power of National Parliaments | -0.20*** | -0.13** | |||
| Explained Variance (adj. R2) | 0.34*** | 0.43*** | 0.53*** | 0.40*** | 0.46*** |
Aggregate regression, cases: policy fields times groups [14 MEP; 10 MNP]), max n = 432, min n = 340.
* sign. at .05; ** sign. at .01; *** sign. at .001.
| Responsibilities of the European Union | |||
| low | high | ||
| Power of the EP to pass laws which directly apply in the member states |
low | Weak State | Strong Intergovernmentalism |
| directly apply in the member states | high | Weak Parliamentarism | Strong Parliamentarism |
| Weak State | Strong Intergovernmentalism | Weak Parliamentarism | Strong Parliamentarism | |
| AU | MEP (p) | |||
| BE | MEP; MNP | |||
| DE | MEP | |||
| FI | MEP | |||
| FR | MNP | MEP | ||
| GE | MEP; MNP(p) | |||
| GR | MNP (p) | MEP | ||
| IR | MEP; MNP | |||
| IT | MEP; MNP | |||
| LU | MNP (p) | MEP | ||
| NE | MNP (p) | MEP | ||
| PO | MEP; MNP | |||
| SP | MEP; MNP | |||
| SW | MEP; MNP | |||
| GB | MEP |
| Correlation with Left-Right Self-placement |
|
| Better coordination (summary score) | .06 |
| Better control (summary score) | .25*** |
| Better electoral link (summary score) | .13*** |
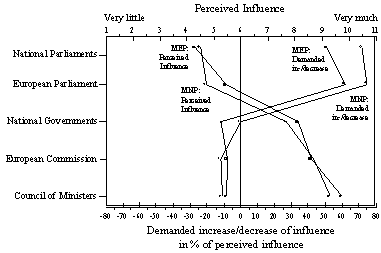
| Demand for increase in power of: | *** = sig .000 |
| - national parliaments | .04 |
| - the European Parliament | .20*** |
| - national governments | -.17*** |
| - European Commission | .01 |
| - Council of Ministers | -.18*** |
| MEP | MNP | |||||
| Left | Centre | Right | Left | Centre | Right | |
| % | % | % | % | % | % | |
| Weak state | 18 | 20 | 68 | 27 | 40 | 54 |
| Strong non-parliamentary state | 9 | 9 | 4 | 13 | 19 | 17 |
| Weak parliamentary state | 7 | 9 | 4 | 8 | 7 | 4 |
| Strong parliamentary state | 66 | 61 | 25 | 52 | 34 | 25 |
| n = 100 % | 122 | 142 | 28 | 390 | 776 | 175 |
| Competence Shift | State Modela | |||
| Std. Canonical Function Coeff./ Correlation with Function 1 |
||||
| - Load | 0.30 | / 0.69 | - | / - |
| - Scope | 0.82 | / 0.38 | - | / - |
| - Export Dependency | 0.51 | / 0.30 | 0.97 | / 0.51 |
| - Union Density | -0.32 | / -0.33 | -0.96 | / -0.52 |
| - Legal Regulation | -0.24 | / -0.22 | -0.03 | / -0.19 |
| Number of cases | 442 | 24 | ||
| Number of Groups defined | 5 | 3 | ||
| Groups/Group Values on Function 1: | ||||
| 1. contra shift | -1.49 | 1. Weak State | -2.89 | |
| 2. | -0.72 | 2. Intergov. | 1.44 | |
| 3. | 0.12 | 3. Parliament | 0.83 | |
| 4. | 0.90 | |||
| 5. pro shift | 1.28 | |||
| Explained Variance, Function 1 | 88.18 | 99.03 | ||
| Eta2 (function 1 score by group) | 0.51*** | 0.76*** | ||
| R2 (function 1 score regressed on group) | 0.50*** | 0.44*** | ||
| Correctly Classified in % | 44.61 | 83.33 | ||
| Mean % Correctly Classified | 45.0 | 72.6 | ||
| Mean % above Prior Probability | 25.2 | 39.3 | ||
*** sig. P < 0.000
a (strong EU + strong EP)/2.
| Study | Fieldwork | Number of Respondents | Return Rate | Duncan Index of Dissimilaritya regarding | |||
| Country | Party | Gender | Age Groups | ||||
| MEP-Study | 20.05.- 21.6.1996 | 314 | 50.2 | 9.11 | 7.99 | 0.32 | 3.50 |
| MNP-Studies: | (29.4.1996-10.7.1997) | 1367 | 37.6 | n.a. | 7.01 | 1.45 | 2.97 |
| - Belgiumb | 3.6.1996-28.4.1997 | 87 | 58.0 | n.a. | 7.20 | 0.60 | 4.00 |
| - France | 2.7.1996-10.7.1997 | 146 | 25.3 | n.a. | 7.70 | 0.40 | 6.90 |
| - Germany | 21.5.-6.8.1996 | 317 | 47.2 | n.a. | 6.80 | 1.50 | 5.60 |
| - Greece | 15.4.-31.7.1996 | 60 | 20.0 | n.a. | 16.30 | 0.70 | 11.30 |
| - Ireland | 9.7.-25.10.1996 | 71 | 42.8 | n.a. | 3.20 | 0.00 | - |
| - Italy | June-Oct. 1996 | 94 | 14.9 | n.a. | 18.30 | 2.40 | - |
| - Luxembourg | 12.6.1996-28.2.1997 | 28 | 46.7 | n.a. | 14.10 | 3.10 | - |
| - Netherlands | 29.4.-19.7.1996 | 65 | 43.3 | n.a. | 10.70 | 3.60 | - |
| - Portugal | 13.6.-4.8.1996 | 54 | 23.5 | n.a. | 8.50 | 0.50 | - |
| - Spain | Autumn 1996 | 130 | 37.1 | n.a. | 4.90 | 2.80 | - |
| - Sweden | 5.3.-10.12.1996 | 315 | 90.3 | n.a. | 1.80 | 1.30 | 0.80 |
| Cross-country Problem Load |
||||
| High (3) | Unemployment | Agriculture Environment Immigrants |
||
| Medium (2) | Region. Devel. Social Policy |
Crime Economy Research |
Defence Devel. Countries Foreign Policy |
|
| Low (1) | Health Education Tax |
Media | Money | |
| Low (1) |
Medium (2) |
High (3) |
Cross-border Problem Scope |
|
Assigned scores in brackets.

Horizontal axis: scores from figure 1
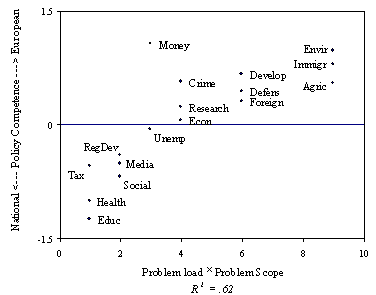

Correlations for Overall Competence Score: MEP and MNP (24 cases; Luxembourg missing): 0.46*; MEP only (14 cases): 0.49; MNP only (10 cases): 0.48.
* sign. at .05.
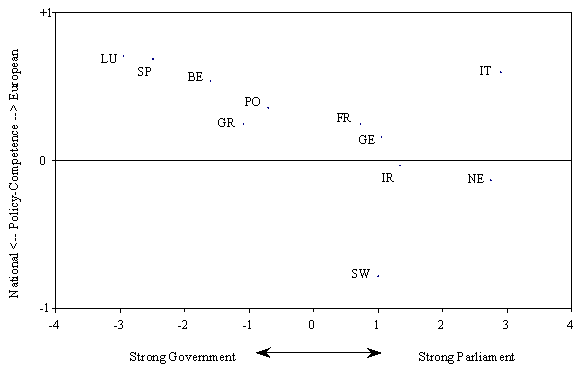
Note: Entries are predicted values.
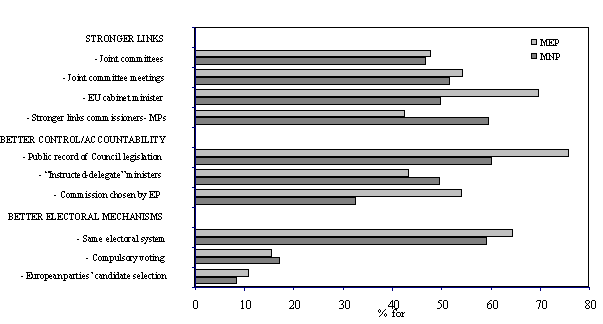
Judgements based on a seven-point scale ranging from 1 (very much for) to 7 (very much against). Percentages represent portion of answers with scale values of 1, 2, and 3.

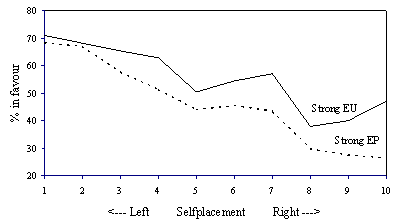
Based on a seven-point scale where 1 indicates very much in favour of a strong EU or EP and 7 indicates being against. Percentage of answers favouring.
