Materialism by age groups in Eastern Europe and the former USSR,
selected countries, ISSP 1993 (Environment)
| ages |
18-24 |
25-34 |
35-44 |
45-54 |
55-64 |
65-high |
average |
| material |
40 |
41 |
44 |
44 |
57 |
58 |
47 |
| posmaterial |
7 |
6 |
5 |
5 |
3 |
1,5 |
5 |
Materialism by age groups in Western Europe, selected countries,
ISSP 1993 Environment
| ages |
18-24 |
25-34 |
35-44 |
45-54 |
55-64 |
65-high |
average |
| material |
16 |
18 |
19 |
23 |
27 |
29 |
21 |
| postmaterial |
15 |
15 |
14 |
14 |
11 |
10 |
8 |
Materialism and GDP per capita in Western and Eastern Europe,
1993
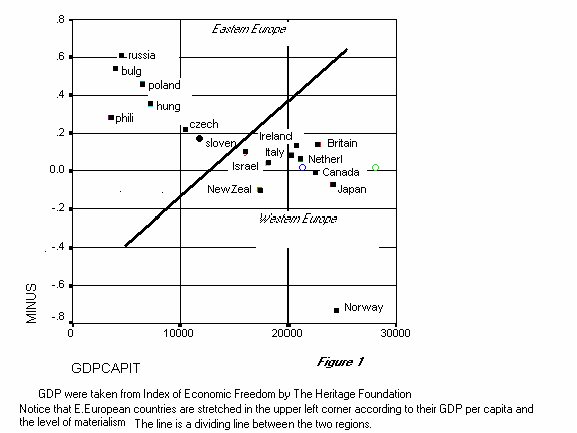
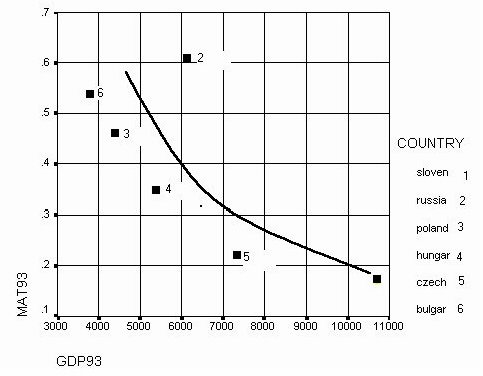
Materialism by GDP per capita in Eastern Europe, 1993 (R=0.752)
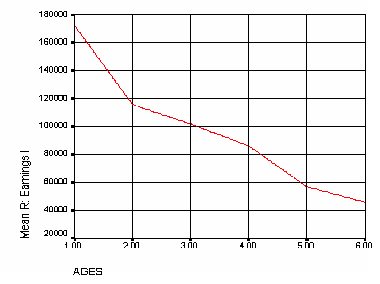
Russia: mean earnings by age group, 1993
| Ages |
Mean |
N |
| 1 |
301862 |
249 |
| 2 |
223089 |
400 |
| 3 |
207413 |
483 |
| 4 |
168934 |
290 |
| 5 |
104470 |
270 |
| 6 |
128126 |
166 |
Bulgaria: mean earnings by age group, 1993
| Ages |
Mean |
N |
| 1 |
123625 |
66 |
| 2 |
130186 |
119 |
| 3 |
115595 |
178 |
| 4 |
93903 |
154 |
| 5 |
49035 |
213 |
| 6 |
13307 |
257 |
Relationship between age groups and earnings in Eastern Europe
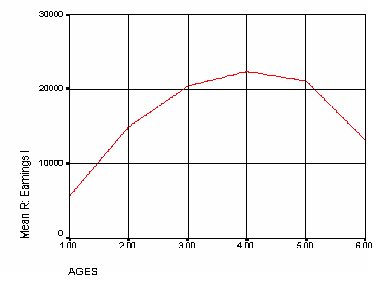
The US: mean earnings by age groups, 1993
| Ages |
Mean |
N |
| 1 |
7203 |
82 |
| 2 |
18328 |
261 |
| 3 |
24147 |
313 |
| 4 |
29231 |
188 |
| 5 |
29532 |
106 |
| 6 |
24560 |
46 |
Relationship between age groups and earnings in Western
democracies
Materialism by age group in Eastern Europe and former USSR: Second
Battery of indicators from WVS 1995
| |
18-24 |
25-34 |
35-44 |
45-54 |
55-64 |
65-high |
average |
| material |
42 |
47 |
50 |
54 |
59 |
62 |
52 |
| postmaterial |
6 |
5 |
4 |
3 |
3 |
2 |
4 |
Materialism and GDP in Eastern Europe: 1990, 1993, and 1995
| |
mat90 |
mat93 |
mat95 |
GDP90 |
GDP93 |
GDP95 |
GDP99 |
| tambov |
na |
na |
0,63 |
na |
na |
na |
na |
| azerbaijan |
na |
na |
0,58 |
na |
na |
1790 |
1550 |
| russia |
0,36 |
0,61 |
0,54 |
9211 |
6120 |
4820 |
4370 |
| moldova |
na |
na |
0,54 |
na |
na |
2670 |
1500 |
| ukraine |
na |
na |
0,51 |
na |
na |
3650 |
2190 |
| georgia |
na |
na |
0,44 |
na |
na |
1060 |
1960 |
| montenegro |
na |
na |
0,47 |
na |
na |
na |
na |
| serbia |
na |
na |
0,45 |
5464 |
na |
1000 |
na |
| hungary |
0,49 |
0,35 |
0,43 |
6108 |
5380 |
5700 |
7200 |
| belarus |
0,27 |
na |
0,43 |
na |
na |
5130 |
4850 |
| armenia |
na |
na |
0,41 |
na |
na |
2290 |
2360 |
| lithania |
0,15 |
na |
0,4 |
na |
na |
3500 |
4220 |
| macedonia |
na |
na |
0,37 |
na |
na |
900 |
na |
| poland |
na |
0,46 |
0,35 |
4565 |
4400 |
4920 |
6520 |
| estonia |
0,26 |
na |
0,35 |
na |
na |
6460 |
5240 |
| latvia |
0,18 |
na |
0,31 |
na |
na |
4480 |
1300 |
| bosnia |
na |
na |
0,29 |
na |
na |
na |
na |
| croatia |
na |
na |
0,14 |
na |
na |
2640 |
4780 |
| slovena |
0,23 |
0,17 |
0,05 |
na |
10700 |
8110 |
11800 |
| czech |
0,13 |
0,22 |
na |
na |
7300 |
7450 |
10510 |
| moscow |
0,14 |
na |
na |
na |
na |
na |
na |
| romania |
0,37 |
na |
na |
3445 |
2700 |
2790 |
na |
| bulgaria |
0,2 |
0,54 |
0,49 |
5710 |
3800 |
3830 |
4010 |
| slovakia |
0,21 |
na |
na |
na |
6100 |
6070 |
na |
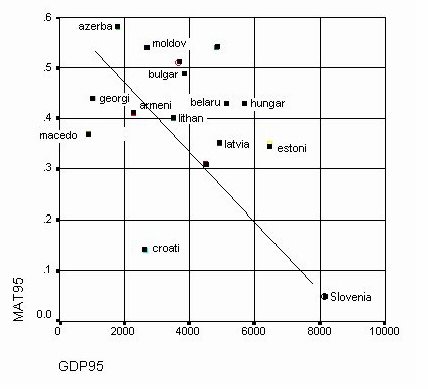
Materialism by GDP per capita in Eastern Europe, 1995
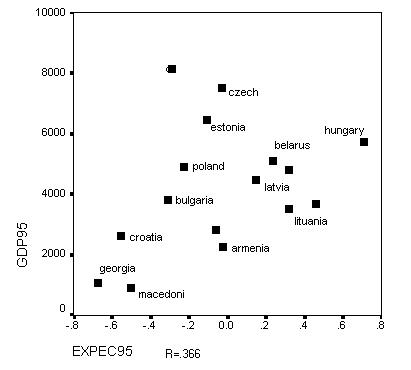
GDP per capita and future expectation in Eastern Europe, 1995
Mean percentage of job aspects by importance for Western and Eastern
Europe, WVS, 1990 and 1995
| |
pay |
pressure |
secu |
respe |
initiat |
holiday |
realizat |
responsib |
abilit |
interest |
| West |
31 |
70 |
66 |
66 |
54 |
72 |
46 |
57 |
41 |
45 |
| East |
13 |
64 |
35 |
52 |
63 |
67 |
48 |
66 |
31 |
40 |
Importance of “pay” for the West by age group, 1990 and
1995
| cohorts |
1 |
2 |
3 |
4 |
5 |
6 |
| West % |
25 |
24,5 |
25,5 |
27 |
33 |
35,5 |
1 represents the youngest age group
Mean percentage of choosing “pay” (WVS, 1990 and 1995
waves)
| |
1990 |
1995 |
| Poland |
53 |
10 |
| Belarus |
13 |
18 |
| Slovenia |
18 |
11 |
| Bulgaria |
9 |
6 |
| Lithuania |
21 |
5 |
| Latvia |
31 |
10 |
| Estonia |
14 |
10 |
| Russia |
17 |
9 |
| West Germany |
26 |
35 |
| Spain |
23 |
24 |
| USA |
14 |
17 |
| Finland |
34 |
40 |
| Japan |
21 |
12 |
| Norway |
40 |
41 |
| Sweden |
27 |
40 |
Materialism minus post-materialism for Western Europe

Taken from Inglehart, 1994.
NOT Reading Samizdat by age groups among Soviet immigrants,
1979
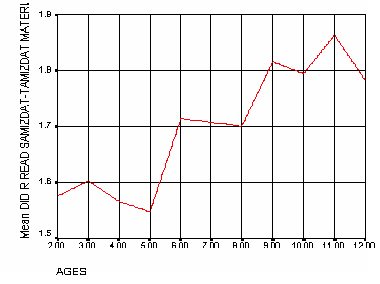
1 indicating "read very often"
Here age increases from 2 to 12
Life satisfaction in Easter Europe by age groups
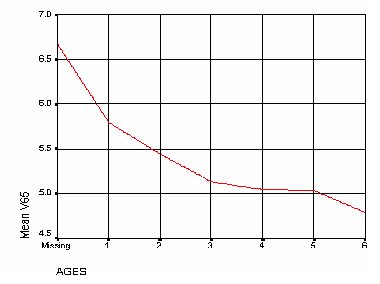
10 indicating "very satisfied" and 1 indicating "very dissatisfied"
Life satisfaction among Soviet immigrants, 1979
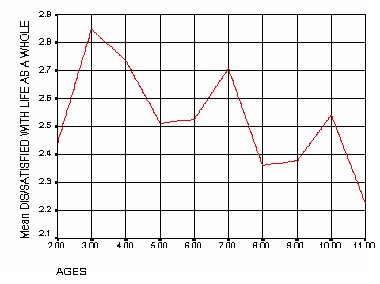
1 indicating "very dissatisfied"
Reported standard of living by age groups, 1979
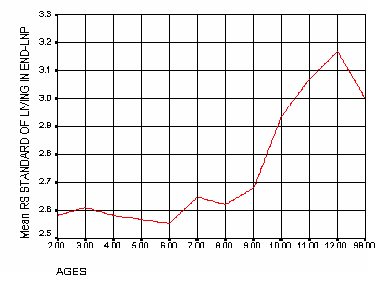
1 indicating "high standards" and 5 indicating "low standards"
Monthly salary at last job, USSR, 1979
| ages |
mean |
N |
| 2 |
118 |
169 |
| 3 |
137 |
356 |
| 4 |
156 |
543 |
| 5 |
172 |
295 |
| 6 |
182 |
464 |
| 7 |
180 |
259 |
| 8 |
171 |
280 |
| 9 |
169 |
296 |
| 10 |
158 |
202 |
| 11 |
139 |
260 |
| 12 |
159 |
55 |
Age increases from 2 to 12
Favoring private enterprise by age groups (1 is the youngest among
Soviet immigrants, 1979
| ages |
1 |
2 |
3 |
4 |
5 |
6 |
7 |
8 |
9 |
10 |
| change political system |
24 |
33 |
58 |
34 |
44 |
25 |
25 |
24 |
14 |
19 |
| allow private enterprise |
14 |
10 |
10 |
10 |
10 |
8 |
12 |
8 |
8 |
1 |
©2001 by Kyvelidis
formated and tagged by S.H.
& MN, 29.3.2001