| 1989 | 1990 | 1991 | 1992 | 1993 | 1994 | 1995 | 1996 | total | |
| Retail Trade | 2149 | 2121 | 1134 | 1051 | 1645 | 1111 | 2761 | 2402 | 14374 |
| Wholesale Trade | 1452 | 1341 | 942 | 690 | 820 | 720 | 1234 | 1087 | 8286 |
| 1 - 4 emp. | 5 - 9 emp. | 10 - 19 emp. | 20 - 99 emp. | > 100 emp. | total | |
| Retail Trade: | ||||||
| number of firms (sample)* | 1,411 (51.1) |
557 (20.1) |
375 (13.6) |
355 (12.9) |
63 (2.3) |
2,761 (100.0) |
| employment (sample) | 3,125 (7.9) |
3,679 (9.3) |
5,049 (12.7) |
13,957 (35.3) |
13,733 (34.7) |
39,543 (100.0) |
| employment (real-world)** | 65,323 (19.9) |
48,455 (14.7) |
41,929 (12.7) |
56,905 (17.3) |
116,336 (35.4) |
328,948 (100.0) |
| Wholesale Trade: | ||||||
| number of firms (sample) | 449 (36.4) |
253 (20.5) |
195 (15.8) |
278 (22.5) |
59 (4.8) |
1,234 (100.0) |
| employment (sample) | 966 (3.6) |
1.728 (6.2) |
2,709 (9.8) |
12,081 (43.8) |
10,059 (36.5) |
27,543 (100.0) |
| employment (real-world) | 23,205 (12.0) |
18,192 (9.3) |
22,338 (11.5) |
55,395 (28.5) |
75,420 (38.7) |
194,550 (100.0) |
* values in parentheses denote the percent shares
** real-world as
observed according to Austrian Industrial Statistics (source: Statistik
Austria)
| 1 - 4 emp. | 5 - 9 emp. | 10 - 19 emp. | 20 - 99 emp. | > 100 emp. | ||
| Retail Trade: | ||||||
| cash flow per employee (1,000 ATS) |
mean median 1st quart. 3rd quart. |
-38.0 -38.0 -148.0 65.5 |
36.0 15.3 -39.1 85.3 |
30.8 25.2 -26.6 75.8 |
44.2 40.3 -0.8 88.4 |
67.7 61.9 16.6 103.5 |
| debt per employee (1,000 ATS) |
mean median 1st quart. 3rd quart. |
1,567.0 1,101.0 644.6 1,897.0 |
1,079.0 839.6 501.5 1,252.0 |
932.5 729.3 469.6 1,163.0 |
873.4 715.2 449.8 1,077.0 |
789.4 745.2 484.1 913.2 |
| financing cost (percent) |
mean median 1st quart. 3rd quart. |
8.0 7.6 5.9 9.2 |
7.7 7.0 5.5 8.6 |
7.3 6.7 5.1 8.5 |
7.0 6.3 4.9 8.3 |
6.6 6.2 4.4 7.4 |
| Wholesale Trade: | ||||||
| cash flow per employee (1,000 ATS) |
mean median 1st quart. 3rd quart. |
235.5 89.8 -102.0 398.0 |
145.2 73.5 -35.0 239.8 |
138.1 78.8 -11.2 253.8 |
109.8 82.0 8.6 182.7 |
134.8 88.3 40.7 182.9 |
| debt per employee (1,000 ATS) |
mean median 1st quart. 3rd quart. |
3,776.0 1,981.0 1,094.0 4,115.0 |
2,748.0 1,681.0 1,007.0 2,943.0 |
1,835.0 1,339.0 784.5 2,420.0 |
1,715.0 1,218.0 813.3 2,002.0 |
1,170.0 940.1 642.0 1,358.0 |
| financing cost (percent) |
mean median 1st quart. 3rd quart. |
8.3 7.1 4.8 9.8 |
7.6 6.9 4.6 9.2 |
7.9 7.0 5.1 9.1 |
7.1 6.4 5.0 8.3 |
6.9 6.1 4.9 8.4 |
| Cash-flow performance (CFP) |
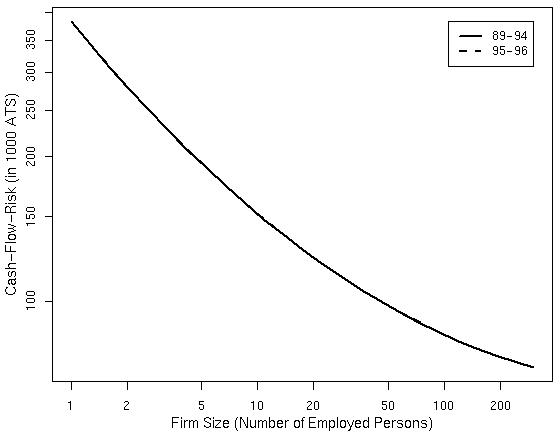
Cash-flow risk (CFR) |
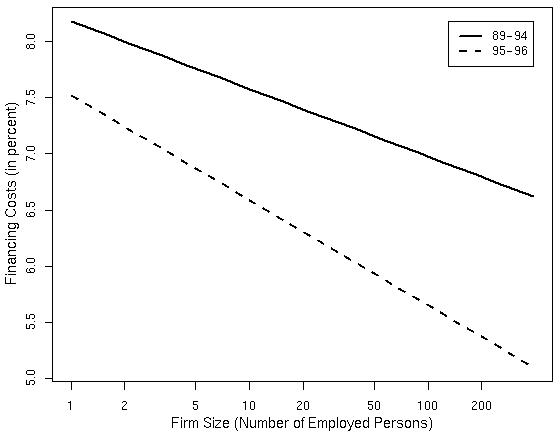
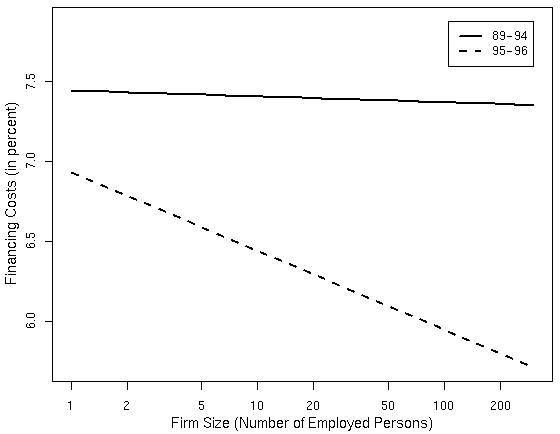
Financing costs (FCO) |
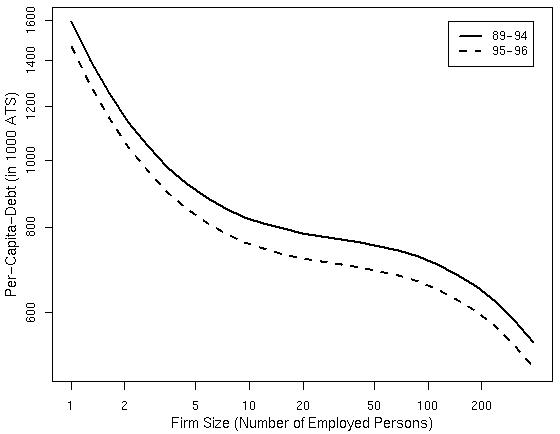
Per-capita debt (LND) |
Number of observations (T) |
|
| Retail Trade | 15.440*** (0.000) |
1.166 (0.321) |
10.656** (0.001) |
2.074 (0.102) |
1592 |
| WholesaleTrade | 6.534* (0.011) |
1.740 (0.176) |
8.094** (0.004) |
10.148*** (0.000) |
914 |
Note: values in parentheses are the prob-values of the
F-statistic, which has J and (T-K) degrees of freedom,
where J, the number of tested restriction depends on model specification
and varies between 1 and 3, K is the number of regressors in the
unrestricted model, accordingly varying between 18 and 22, and T is the
number of observations.
***, **, * denote statistical significance at
confidence levels of 0.1, 1 and 5 percent.
| Variable | Cash-flow Performance (CFP) | Cash-flow Risk (CFR) | Financing Cost (FCO) | Per-capita Debt (LND) |
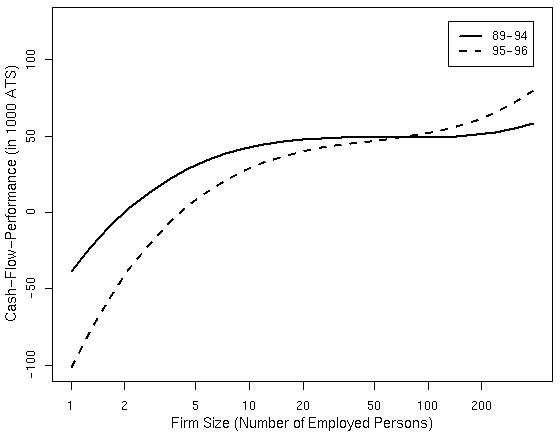
| X | 66.006 *** (0.0000) |
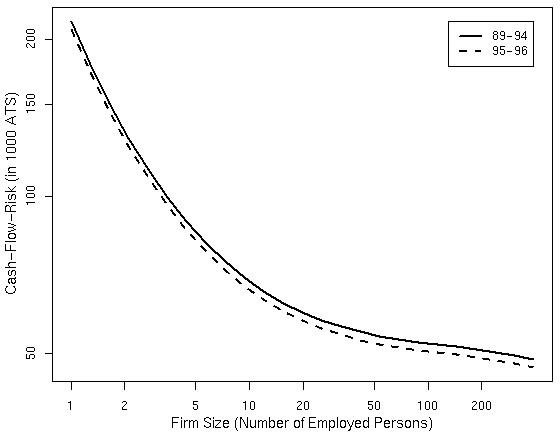
-0.804 *** (0.0000) |
-0.262 *** (0.0000) |
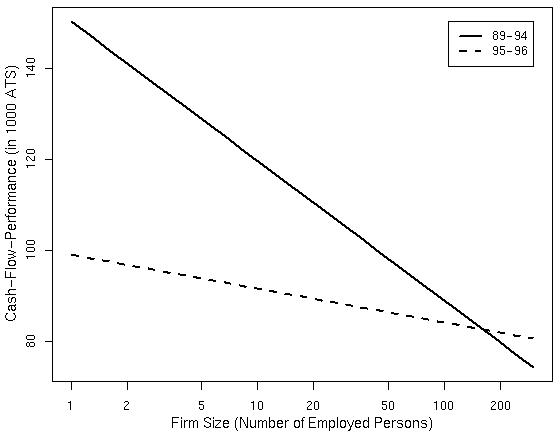
-0.559 *** (0.0000) |
| X2 | -16.512 *** (0.0000) |
0.157 *** (0.0000) |
0.151 *** (0.0000) |
|
| X3 | 1.368 *** (0.0000) |
0.011 ** (0.0034) |
-0.015 ** (0.0000) |
|
| Y = D95/96X | 37.293 ** (0.0056) |
-0.145 ** (0.0011) |
||
| Y = D95/96X2 | -8.707 (0.1043) |
|||
| Y = D95/96X3 | 0.811 (0.1971) |
|||
| R2adj. | 0.290 | 0.472 | 0.339 | 0.562 |
| F-Stat | 31.940 *** | 80.062 *** | 48.950 *** | 114.440 *** |
| Num. Obs. | 1592 | 1592 | 1592 | 1592 |
| Num.Coeff. | 22 | 19 | 18 | 19 |
Note: values in parentheses are the prob-values of the
t-statistic and F-statistic, respectively. Estimation results for
the intercept and 15 dummy-variables for each year and region are not reported
here. They are available in Fink and Koller (2001).
***, ** and * denote
statistical significance at confidence levels of 0.1, 1 and 5
percent.
| Variable | Cash-flow Performance (CFP) | Cash-flow Risk (CFR) | Financing Cost (FCO) | Per-capita Debt (LND) |
| X | -13.308 *** (0.0000) |
-0.476 *** (0.0000) |
-0.016 (0.6659) |
-0.308 *** (0.0000) |
| X2 | 0.032 *** (0.0001) |
0.015 ** (0.0055) |
||
| X3 | ||||
| Y = D95/96X | 10.081 * (0.0107) |
-0.198 ** (0.0045) |
0.145 ** (0.0031) |
|
| Y = D95/96X2 | -0.017 ** (0.0953) |
|||
| Y = D95/96X3 | ||||
| R2adj. | 0.053 | 0.416 | 0.217 | 0.511 |
| F-Stat | 3.999*** | 39.291 *** | 15.890 *** | 51.190 *** |
| Num. Obs. | 914 | 914 | 914 | 914 |
| Num.Coeff. | 18 | 18 | 18 | 20 |
Note: values in parentheses are the prob-values of the
t-statistic and F-statistic, respectively. Estimation results for
the intercept and 15 dummy-variables for each year and region are not reported
here. They are available in Fink and Koller (2001).
***, ** and * denote
statistical significance at confidence levels of 0.1, 1 and 5 percent.