| Size
of country |
MS | Population | NICE | CONST | RULE B | ALTER | ||||
| WV | MAJ | POP | MAJ | POP | WV | WV | MAJ | |||
| large | D | 82545 | 29 | 1 | 181 | 1 | 181 | 1035 | 29 | 1 |
| GB | 59518 | 29 | 1 | 131 | 1 | 131 | 879 | 24 | 1 | |
| F | 59869 | 29 | 1 | 132 | 1 | 132 | 881 | 24 | 1 | |
| I | 57482 | 29 | 1 | 126 | 1 | 126 | 864 | 24 | 1 | |
| E | 40978 | 27 | 1 | 90 | 1 | 90 | 729 | 20 | 1 | |
| P | 38194 | 27 | 1 | 84 | 1 | 84 | 704 | 20 | 1 | |
| medium | NL | 16258 | 13 | 1 | 36 | 1 | 36 | 459 | 13 | 1 |
| GR | 11047 | 12 | 1 | 24 | 1 | 24 | 379 | 11 | 1 | |
| CZ | 10211 | 12 | 1 | 22 | 1 | 22 | 364 | 10 | 1 | |
| B | 10397 | 12 | 1 | 23 | 1 | 23 | 367 | 10 | 1 | |
| HU | 10115 | 12 | 1 | 22 | 1 | 22 | 362 | 10 | 1 | |
| P | 10480 | 12 | 1 | 23 | 1 | 23 | 369 | 10 | 1 | |
| S | 8975 | 10 | 1 | 20 | 1 | 20 | 341 | 9 | 1 | |
| AU | 8092 | 10 | 1 | 18 | 1 | 18 | 324 | 9 | 1 | |
| minor | SK | 5381 | 7 | 1 | 12 | 1 | 12 | 264 | 7 | 1 |
| DN | 5398 | 7 | 1 | 12 | 1 | 12 | 265 | 7 | 1 | |
| FN | 5220 | 7 | 1 | 11 | 1 | 11 | 260 | 7 | 1 | |
| IR | 4025 | 7 | 1 | 9 | 1 | 9 | 229 | 6 | 1 | |
| LI | 3447 | 7 | 1 | 8 | 1 | 8 | 212 | 6 | 1 | |
| LA | 2319 | 4 | 1 | 5 | 1 | 5 | 173 | 5 | 1 | |
| SL | 1997 | 4 | 1 | 4 | 1 | 4 | 161 | 4 | 1 | |
| ES | 1351 | 4 | 1 | 3 | 1 | 3 | 132 | 4 | 1 | |
| small | CY | 728 | 4 | 1 | 2 | 1 | 2 | 97 | 3 | 1 |
| L | 451 | 4 | 1 | 1 | 1 | 1 | 77 | 2 | 1 | |
| ML | 400 | 3 | 1 | 1 | 1 | 1 | 72 | 2 | 1 | |
| Total | 451039 | 321 | 25 | 1000 | 25 | 1000 | 9999 | 276 | 25 | |
| Quota | =72,3% | >50% | =62% | >50% | =60% | =60% | =2/3 | >50% | ||
| Note: | |
| NICE | decision-making rule as defined by Declaration on the enlargement of the EU annexed to the Treaty of Nice and the Art. 12 of the Act of Accession signed on 16 April 2003 with ten candidate countries |
| CONST | decision-making rule as defined by Art. I-24 of the Draft Treaty on the Constitution for Europe |
| RULE B | decision-making rule designed and analysed in F&M (2000) |
| ALTER | alternative proposal of the decision-making rule |
| WV | weighted votes |
| MAJ | majority of member states |
| POP | share of population (in form of weighted votes) |
| Share of population of member state in Nice and Draft Constitution rules is set as percentage of the total EU population, rounded off and multiplied by 10. The sum of thus defined weighted votes adds to 1000. (Neither of the treaties provides for the procedure how to determine the share of population.) | |
| Distribution of weighted votes in Rule B is constructed as follows: the share of the square root of population of the member state of the total of square roots of all members, multiplied by 10000, rounded off. The sum of weighted votes should add to 10000, due to rounding in this particular application of the method the sum total is 9999. For the purpose of calculation of voting power, this does not influence the results. | |
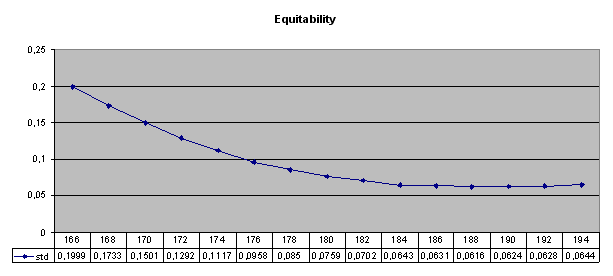
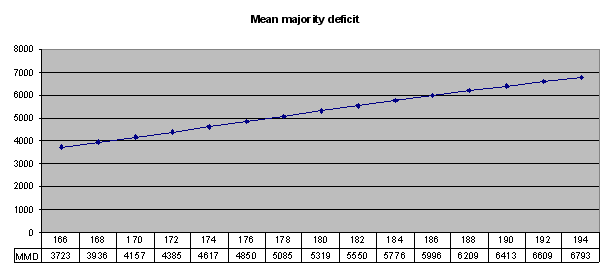
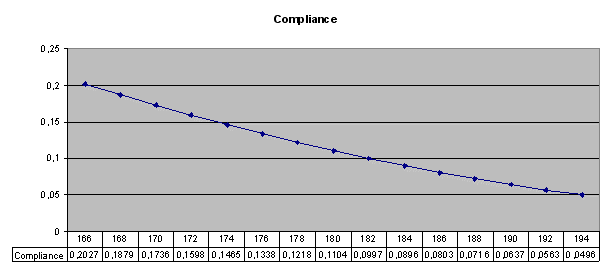
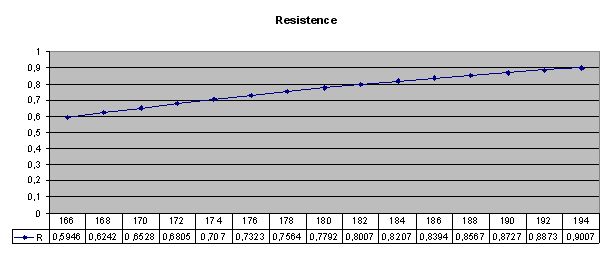
| threshold QM % |
64,49% | 65,22% | 65,94% | 66,66% | 67,39% | 68,38% | 68,84% | 69,57% | 70,29% |
| threshold QM votes |
178 | 180 | 182 | 184 | 186 | 188 | 190 | 192 | 194 |
| blocking minority votes |
99 | 97 | 95 | 93 | 91 | 89 | 87 | 85 | 83 |
| blocking minority – position of groups of member countries* | D+3 other biggest; any 5 big; 11 medium and minor (starting NL ↓) | D+3 big (1 may be E or PL); any 5 big; 11 medium and minor (starting NL ↓) | D+3 big (1 may be E or PL); any 5 big; 10 medium and minor (starting NL ↓) | D+3 big (incl. E and PL); any 5 big; GB+F+I+2medium; 10 medium and minor (starting NL ↓) | D+3 big (incl. E and PL); 4 big without D; GB+F+I+2medium; 10 medium and minor (starting NL ↓ ) | D+3 big (incl. E and PL); 4 big without D; GB+F+I+2medium; 9 medium and minor (starting NL ↓ ) | D+3 big (incl. E and
PL); 4 big without D; 3 big+2 medium; 9 medium and minor (starting
NL ↓ ) |
D+3 big (incl. E and PL); 4 big without D; any 3 big+2 medium; 9 medium (starting NL ↓ ) | D+3 big (incl. E and PL); D+5 medium starting NL ↓);4 big without D; any 3 big+2 medium; 9 medium and minor (without NL), 8 incl. NL |
* Combinations of member states from various groups forming the blocking minority (only examples).
| MS | NICE | CONST | RULE B | ALTER | ||||
| ß | ß | ß | ß | |||||
| D | 0,0551 | 0,0856 | 0,3074 | 0,1328 | 0,2484 | 0,1047 | 0,1337 | 0,0997 |
| GB | 0,0550 | 0,0856 | 0,2200 | 0,0950 | 0,2100 | 0,0885 | 0,1136 | 0,0848 |
| F | 0,0550 | 0,0856 | 0,2214 | 0,0956 | 0,2105 | 0,0887 | 0,1136 | 0,0848 |
| I | 0,0550 | 0,0856 | 0,2128 | 0,0919 | 0,2064 | 0,0870 | 0,1136 | 0,0848 |
| E | 0,0522 | 0,0812 | 0,1612 | 0,0696 | 0,1733 | 0,0731 | 0,0960 | 0,0716 |
| PL | 0,0522 | 0,0812 | 0,1563 | 0,0675 | 0,1673 | 0,0705 | 0,0960 | 0,0716 |
| NL | 0,0272 | 0,0423 | 0,0845 | 0,0365 | 0,1084 | 0,0457 | 0,0637 | 0,0475 |
| GR | 0,0251 | 0,0391 | 0,0686 | 0,0296 | 0,0894 | 0,0377 | 0,0542 | 0,0404 |
| CZ | 0,0251 | 0,0391 | 0,0660 | 0,0285 | 0,0858 | 0,0362 | 0,0494 | 0,0369 |
| B | 0,0251 | 0,0391 | 0,0673 | 0,0291 | 0,0865 | 0,0365 | 0,0494 | 0,0369 |
| HU | 0,0251 | 0,0391 | 0,0660 | 0,0285 | 0,0854 | 0,0360 | 0,0494 | 0,0369 |
| P | 0,0251 | 0,0391 | 0,0673 | 0,0291 | 0,0870 | 0,0367 | 0,0494 | 0,0369 |
| S | 0,0210 | 0,0327 | 0,0633 | 0,0273 | 0,0804 | 0,0339 | 0,0446 | 0,0333 |
| AU | 0,0210 | 0,0327 | 0,0607 | 0,0262 | 0,0764 | 0,0322 | 0,0446 | 0,0333 |
| SK | 0,0149 | 0,0231 | 0,0526 | 0,0227 | 0,0622 | 0,0262 | 0,0350 | 0,0261 |
| DK | 0,0149 | 0,0231 | 0,0526 | 0,0227 | 0,0624 | 0,0263 | 0,0350 | 0,0261 |
| FN | 0,0149 | 0,0231 | 0,0513 | 0,0221 | 0,0612 | 0,0258 | 0,0350 | 0,0261 |
| IR | 0,0149 | 0,0231 | 0,0486 | 0,0210 | 0,0539 | 0,0227 | 0,0302 | 0,0225 |
| LI | 0,0149 | 0,0231 | 0,0473 | 0,0204 | 0,0499 | 0,0210 | 0,0302 | 0,0225 |
| LA | 0,0085 | 0,0133 | 0,0432 | 0,0187 | 0,0407 | 0,0172 | 0,0254 | 0,0189 |
| SL | 0,0085 | 0,0133 | 0,0419 | 0,0181 | 0,0379 | 0,0160 | 0,0205 | 0,0153 |
| ES | 0,0085 | 0,0133 | 0,0405 | 0,0175 | 0,0311 | 0,0131 | 0,0205 | 0,0153 |
| CY | 0,0085 | 0,0133 | 0,0392 | 0,0169 | 0,0228 | 0,0096 | 0,0156 | 0,0116 |
| L | 0,0085 | 0,0133 | 0,0378 | 0,0163 | 0,0181 | 0,0076 | 0,0107 | 0,0080 |
| ML | 0,0064 | 0,0099 | 0,0378 | 0,0163 | 0,0169 | 0,0071 | 0,0107 | 0,0080 |
| total | 0,6426 | 1 | 2,3156 | 1 | 2,3723 | 1 | 1,34 | 1 |
| MS | NICE | CONST | RULE B | ALTER |
|
|
|
|
|
|
| D | 0,827 | 1,2831 | 1,0116 | 0,9633 |
| GB | 0,974 | 1,0809 | 1,0070 | 0,9649 |
| F | 0,9711 | 1,0846 | 1,0063 | 0,9620 |
| I | 0,9911 | 1,0640 | 1,0073 | 0,9818 |
| E | 1,1135 | 0,9544 | 1,0024 | 0,9818 |
| PL | 1,1533 | 0,9588 | 1,0014 | 1,0170 |
| NL | 0,9209 | 0,7946 | 0,9949 | 1,0341 |
| GR | 1,0327 | 0,7818 | 0,9957 | 1,0670 |
| CZ | 1,0741 | 0,7829 | 0,9944 | 1,0137 |
| B | 1,0644 | 0,7922 | 0,9937 | 1,0046 |
| HU | 1,0792 | 0,7866 | 0,9936 | 1,0185 |
| P | 1,0602 | 0,7891 | 0,9951 | 1,0006 |
| S | 0,9581 | 0,7999 | 0,9933 | 0,9757 |
| AU | 1,0091 | 0,8085 | 0,9936 | 1,0276 |
| SK | 0,8741 | 0,8590 | 0,9914 | 0,9877 |
| DK | 0,8728 | 0,8577 | 0,9937 | 0,9861 |
| FN | 0,8875 | 0,8491 | 0,9913 | 1,0028 |
| IR | 1,0107 | 0,9188 | 0,9932 | 0,9845 |
| LI | 1,0922 | 0,9645 | 0,9929 | 1,0638 |
| LA | 0,7667 | 1,0779 | 0,9915 | 1,0895 |
| SL | 0,8262 | 1,1243 | 0,9939 | 0,9504 |
| ES | 1,0044 | 1,3216 | 0,9893 | 1,1555 |
| CY | 1,3683 | 1,7387 | 0,9877 | 1,1934 |
| L | 1,7385 | 2,1306 | 0,9934 | 1,0457 |
| ML | 1,3741 | 2,2623 | 0,9854 | 1,1104 |
| std | 0,2055 | 0,4031 | 0,0077 | 0,0643 |
| max d | 0,7385 | 1,2623 | 0,0116 | 0,1934 |
| min d | -0,2333 | -0,2182 | -0,0146 | -0,0496 |
| Rule | equitability std |
equitability max d |
equitability min d |
MMD | compliance A |
resistance R |
| EU 12 1990 | 0,2404 | 0,6331 | -0,1918 | not comparable | 0,0982 | 0,8041 |
| EU 15 2000 | 0,3373 | 1,2222 | -0,2007 | not comparable | 0,0778 | 0,8445 |
| NICE | 0,2055 | 0,7385 | -0,2333 | 7202 | 0,0359 | 0,9283 |
| CONST | 0,4031 | 1,2623 | -0,2182 | 3560 | 0,2253 | 0,5494 |
| RULE B | 0,0077 | 0,0116 | -0,0146 | 3587 | 0,1880 | 0,6241 |
| ALTER | 0,0643 | 0,1934 | -0,0496 | 5776 | 0,0896 | 0,8207 |


