
| actor constel- lation t1 |
integration
t2 |
Europeani- zation t3 |
resulting regulation |
|
| monetary and fiscal policy |
conservative- liberal coalition |
strong | strong | EMU: hard law |
| t4 | t5 | t6 | ||
| employment and social policy |
social democratic coalition |
weak | weak | OMC: soft law |

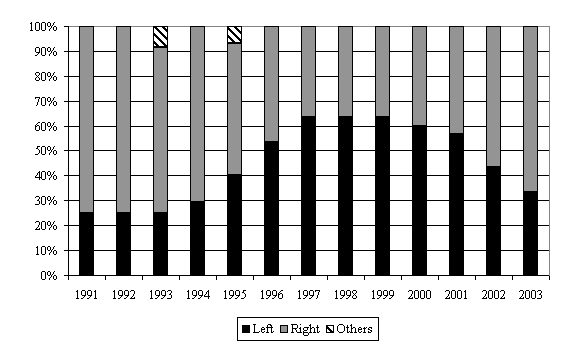
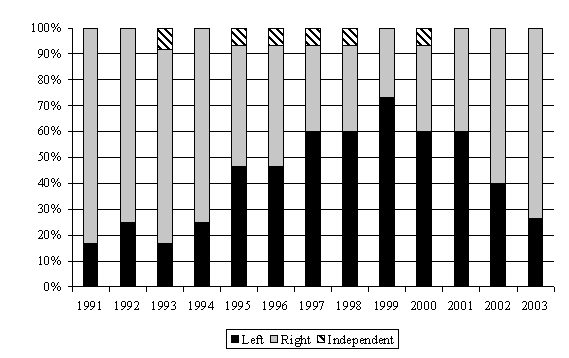
*Based on a data-set of Schmidt et al. (2003). 2003: own data. For 1997 and 2000 the data refer to the time of the Amsterdam and Lisbon summit respectively. Numbers in graph 1 refer to the percentage of ministers of the left (Communists, Socialists, Social Democrats and Greens) and the right (Christian Democrats, Centrists, Conservatives, Liberals and the non-regionalist Right). Others refers to ministers or prime ministers without party affiliation; in graph 2 these mainly are technocratic governments in Italy.
